Data Visualization
Reference documents in Data Visualization.
Documents in Data Visualization
Page 1 of 1-
This book shows how to design interactive charts and maps for your website. We begin with drag-and-drop tools and gradually work our way up to editing open-source code templates. This friendly introduction includes step-by-step tutorials, video screencasts, and real-world examples. Featured tools include Google Sheets, Tableau Public, Carto, Highcharts, Leaflet, GitHub, and more.
-
Enormous quantities of data go unused or underused today, simply because people can't visualize the quantities and relationships in it.
-
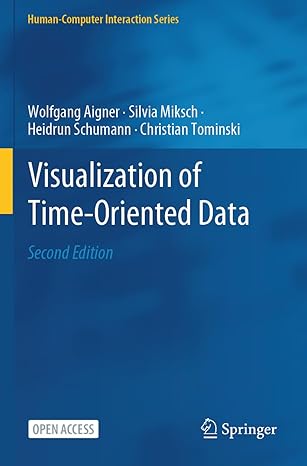
This practical book maintains a brief introduction to visualization and a review of historical time-oriented visual representations. At its core, the book develops a systematic view of the visualization of time-oriented data.
-
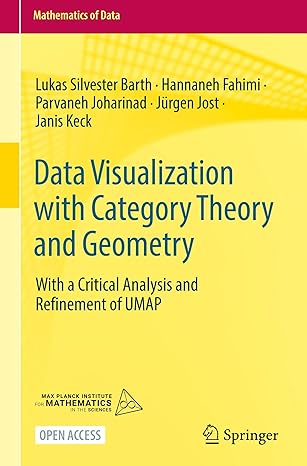
This open access book provides a robust exposition of the mathematical foundations of data representation, focusing on two essential pillars of dimensionality reduction methods, namely geometry in general and Riemannian geometry in particular, and category theory.
-
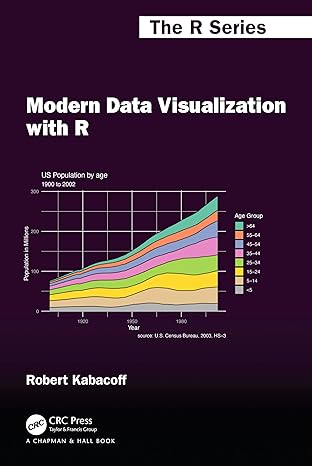
This book describes the many ways that raw and summary data can be turned into visualizations that convey meaningful insights. It is written for those new to data analysis as well as the seasoned data scientist.
-
This is a book for beginner to intermediate Python developers and will guide you through simple data manipulation with Pandas, cover core plotting libraries like Matplotlib and Seaborn, and show you how to take advantage of declarative and experimental libraries like Altair.